Maps and Tables
The Union of Soviet Socialist Republics, 1936
Constituent Republics (1936):
Armenian, Azerbaijan, Byelorussian (“White Russian”), Georgian, Kazakh, Kyrghyz, Russian, Tajik, Turkmen, Ukrainian, Uzbek
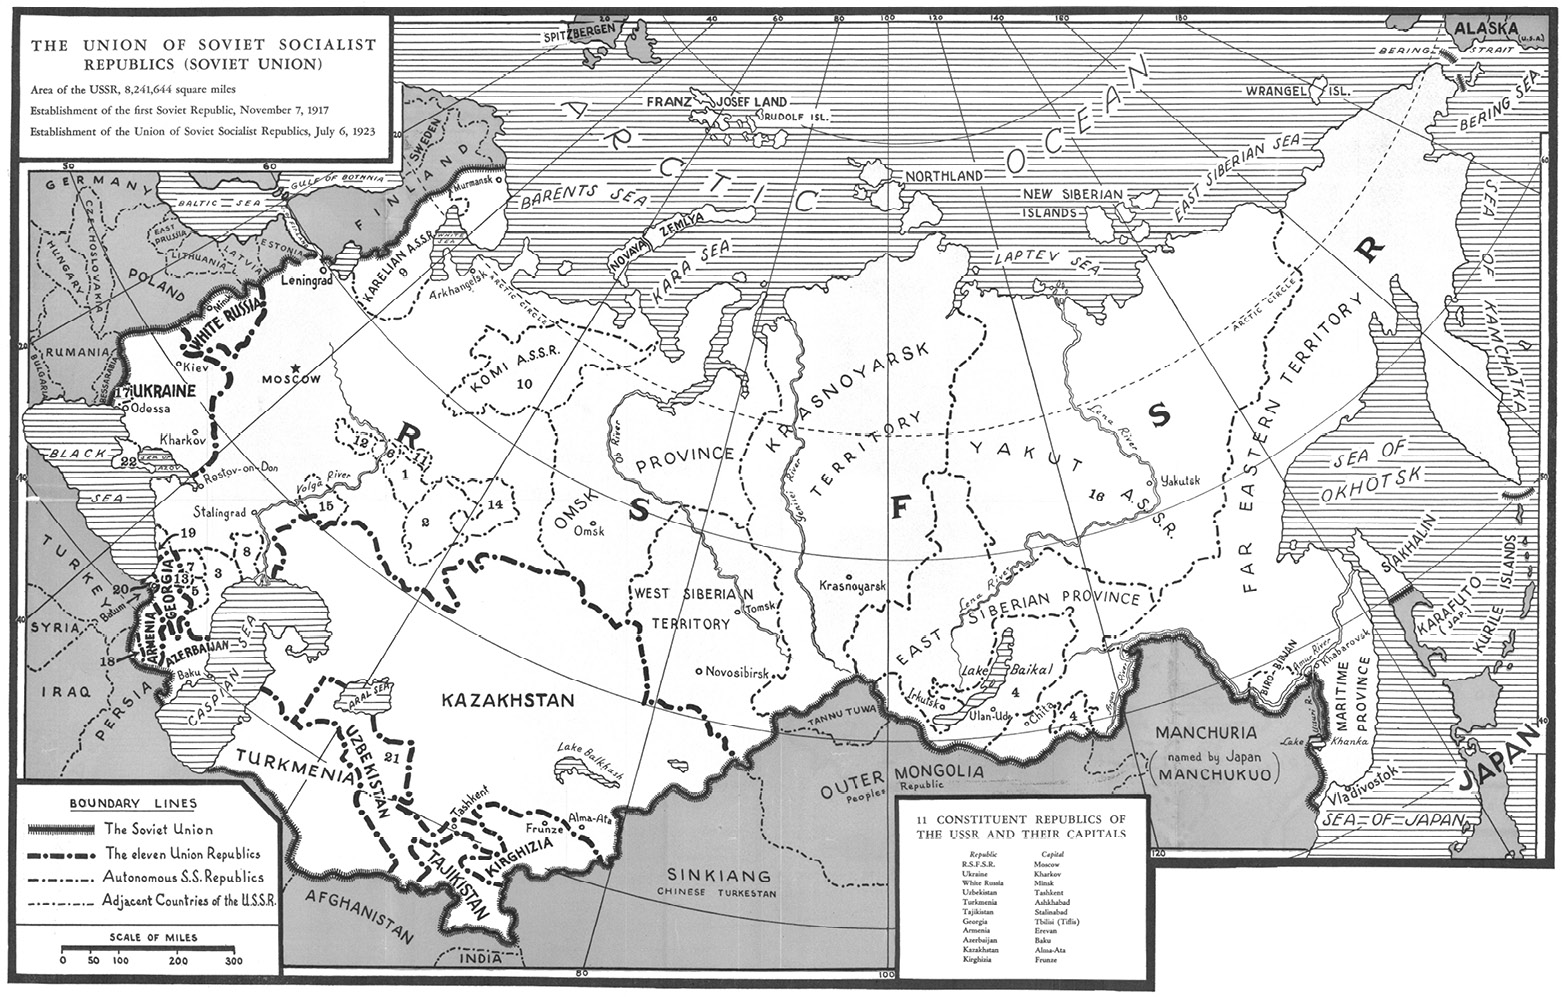
Autonomous Republics included within the Constituent Republics:
1. Tatar 2. Bashkir 3. Dagestan 4. Buryat-Mongolian 5. Chechen-Ingush
6. Chuvash 7. Kabardino-Balkarian 8. Kalmyk 9. Karelian 10. Komi
11. Mariisk 12. Mordva 13. N. Osetian 14. Udmurt 15. Volga-German
16. Yakut 17. Moldavian 18. Nakhichevan 19. Abkhazian 20. Ajarian
21. Jara-Kalpak 22. Crimean
Map source: Soviet Russia Today, New York
Nationality of workers in each republic and autonomous region of the USSR in 1926 |
||||
| Total no. of workers | % Belonging to nationalities: | |||
| Titular | Russian | Other | ||
| Ukraine | 1,071,856 | 54.64 | 29.17 | 16.19 |
| Byelorussia | 121,913 | 58.86 | 13.33 | 27.81 |
| Azerbaijan | 149,211 | 42.58 | 22.50 | 34.02 |
| Armenia | 28,295 | 80.88 | 1.42 | 17.70 |
| Uzbekistan | 136,921 | 50.37 | 17.50 | 32.13 |
| Tajikistan | 20,350 | 63.47 | 1.28 | 35.28 |
| Turkmenistan | 25,933 | 26.61 | 35.06 | 38.33 |
| Bashkiria | 69,196 | 17.77 | 58.83 | 23.40 |
| Buriat-Mongol | 10,857 | 16.28 | 73.11 | 10.61 |
| Daghestan | 42,180 | 72.84 | 17.21 | 9.93 |
| Kazakhstan | 151,987 | 39.43 | 34.25 | 26.32 |
| Karelia | 23,222 | 34.81 | 61.53 | 3.66 |
| Kirghizia | 16,453 | 26.49 | 24.88 | 48.63 |
| Crimea (Tatars) | 49,154 | 13.26 | 55.93 | 31.01 |
| Volga Germans | 24,091 | 58.24 | 27.89 | 13.87 |
| Tatar | 34,909 | 22.65 | 74.64 | 2.71 |
| Chuvash | 4,748 | 17.84 | 75.36 | 6.80 |
| Yakuts | 6,409 | 70.92 | 21.30 | 7.78 |
‘Titular’ refers to being the titular nationality of that Republic, so 54.64 per cent of the workers in Ukraine are Ukranian.
Natsional’naia politika VKP(b), Moscow, 1930, pp. 126-8, via Smith, Jeremy Robert Charnock, ‘The Bolsheviks and the National Question, 1917-1923’, 1996.
Linguistic composition of the Russian Empire in 1897
| Language | Native speakers | % |
|---|---|---|
| Russian | 55,667,469 | 44.31 |
| Ukrainian | 22,380,551 | 17.81 |
| Polish | 7,931,307 | 6.31 |
| Belarusian | 5,885,547 | 4.68 |
| Jewish languages | 5,063,156 | 4.03 |
| Kyrgyz-Kaisak | 4,084,139 | 3.25 |
| Tatar | 3,737,627 | 2.97 |
| German | 1,790,489 | 1.43 |
| Latvian | 1,435,937 | 1.14 |
| Bashkir | 1,321,363 | 1.05 |
| Lithuanian | 1,210,510 | 0.96 |
| Armenian | 1,173,096 | 0.93 |
| Romanian | 1,121,669 | 0.89 |
| Mordovian | 1,023,841 | 0.81 |
| Estonian | 1,002,738 | 0.80 |
| Sartic | 968,655 | 0.77 |
| Chuvash | 843,755 | 0.67 |
| Georgian | 823,968 | 0.66 |
| Uzbek | 726,534 | 0.58 |
| Samogitian | 448,022 | 0.36 |
| Votyak | 420,970 | 0.34 |
| Mari | 375,439 | 0.30 |
| Tajik | 350,397 | 0.28 |
| Buryat | 288,663 | 0.23 |
| Turkmen | 281,357 | 0.22 |
| Mingrelian | 239,625 | 0.19 |
| Yakut | 227,384 | 0.18 |
| Chechen | 226,496 | 0.18 |
A further seventy-six recorded languages are not presented here.
A General Summary for the Empire of the Results of the Development of Data From the First General Census of Population, Vol. 2, NA Troinitsky (ed.), St. Petersburg, 1905, via Demoscope Weekly, 2010.
Religious composition of the Russian Empire in 1897
| Faith | Number | % |
|---|---|---|
| Eastern Orthodox | 87,123,604 | 69.34 |
| Muslim | 13,906,972 | 11.07 |
| Roman Catholic | 11,467,994 | 9.13 |
| Jewish | 5,215,805 | 4.15 |
| Lutherans | 3,572,653 | 2.84 |
| Old Believers | 2,204,596 | 1.75 |
| Armenian Apostolic | 1,179,241 | 0.94 |
| Buddhists | 433,863 | 0.34 |
| Reformed | 85,400 | 0.07 |
| Mennonite | 66,564 | 0.05 |
| Armenian Catholic | 38,840 | 0.03 |
| Baptist | 38,139 | 0.03 |
| Karaite | 12,894 | 0.01 |
| Anglican | 4,183 | 0.00 |
| Other Christian denominations | 3,952 | 0.00 |
| Other non-Christian denominations | 285,321 | 0.23 |
A General Summary for the Empire of the Results of the Development of Data From the First General Census of Population, Vol. 2, NA Troinitsky (ed.), St. Petersburg, 1905, via Demoscope Weekly, 2010.