K. Marx. British Commerce
During the late extraordinary session of the British Parliament, Lord Derby declared in the House of Lords that, for the last three years the value of British imports had exceeded that of British exports to the amount of £160,000,000.(1) This statement gave rise to a controversy, out of doors, some private individuals applying to Lord Stanley of Alderley, President of the Board of Trade, for information as to the correctness of Lord Derby's statement. The President of the Board of Trade, in a letter addressed to his interrogators, replied:
"The assertion made by Lord Derby in the House of Lords, that the value of our imports during the last three years had exceeded that of our exports by £160,000,000, is incorrect, and arises from Lord Derby having taken the total value of our imports, including our imports from the Colonies and foreign countries, while he has excluded the re-export of merchandize which has been received from the Colonies and foreign countries. Thus Lord Derby's calculation shows:
"Importations £468,000,000 Exports 308,000,000
Difference £160,000,000
'Whereas it should be:
Importations £468,000,000 Exports 371,000,000,
Difference £97,000,000" (2) The President of the Board of Trade substantiates this assertion by adding to it a comparative statement of the value of the exports and imports of the United Kingdom during the years 1855, 1856 and 1857. This highly interesting document, which is not to be found in the London newspapers, we reprint below.(3) First it will be seen that the case might be put in a shape confirmatory of Lord Derby's assertion, viz.:
Total imports £468,000,000 British exports 308,000,000
Excess of imports over British exports .. £160,000,000 Re-exports of foreign produce 63,000,000
Balance of trade against Great Britain £97,000,000
Thus, there is actually an excess of foreign imports over British exports of 160,000,000, and after the re-export of 63,000,000 of foreign productions, there remains a balance of trade against Great Britain, as stated by the President of the Board of Trade himself, of 97,000,000, or more than 32,000,000 for the average of the three years, 1855, 1856, and 1857. Hence, the recent complaint of The London Times:
"The actual losses sustained by the nation have been going on for the last five or six years, and it is only now that we have found them out." (4)
These losses, however, arise not from the excess of imports over exports, but from the specific character of a great part of the exports.
The fact is, one-half the re-exports consists of foreign raw materials used in manufactures serving to increase foreign rivalry against the British industrial interests, and, to some extent, returned to the Britishers in manufactured goods for their home consumption. The decisive point, however, to be kept in view, is this, that the large re-exports of raw materials, resulting from the competition of Continental manufactures, enhanced the price of the raw material so much as almost to absorb the profit left to the British manufacturer. On a former occasion, we made some statements in this sense with respect to the British Cotton industry.
As at the present moment the industrial crisis rages most violently in the British Woolen districts, where failure follows upon failure, anxiously concealed from the general public by the London press, it may be opportune to give at this place some figures showing into what effective competition for raw wool the manufacturers of the European Continent were entering with the British ones — a competition which led to the unparalleled enhancement in the price of that raw material, ruinous to the manufacturer, and fostering the now blown-up speculations in that article. The following statement comprises the first nine months of each of the last five years':
Imports.
Year. Foreign. Colonial. Total.
1853 £37,586,199 £46,277,276 £83,863,475 1854 27,006,173 50,187.692 77,193,865 1855 17,293,842 53,896,173 71,190,015 1856 22,377,714 62,148,467 84,526,181 1857 27,604,364 63,053,100 90,657,464
Exports.
Year. Foreign. Colonial. Total.
1853 £2,480,410 £5,243,166 £7,723,576 1854 5,993,366 13,117,102 19,110,468 1855 8,860,904 12,948,561 21,809,465 1856 5,523,345 14,433,958 19,957,303 1857 4,561,000 25,068,787 29,629,787
The quantities of foreign and colonial wools returned for British home consumption appear, therefore, to have been, in the years:
Year Wool. Pounds
1853 76,139,899 1854 58,083,397 1855 49,380,550 1856 64,568,878 1857 61,027,677 On the other hand, the quantities of British home-grown wool exported were:
1853 lb 4,755,443 1854 9,477,396 1855 13,592,756 1856 11,539,201 1857 13,492,386 By deducting from the quantity of foreign wools imported into the United Kingdom, first the quantity re-exported and next the quantities of English wools exported, we find the following real quantities of foreign wool available for British home consumption:
1853 lb 71,384,456 1854 48,606,001 1855 35,787,794 1856 53,029,677 1857 47,535,291
While, therefore, the import into the United Kingdom of colonial wool increased from 46,277,276 lbs. in the first nine months of 1853 to 63,053,100 lbs. in the same period of 1857, and the total imports of all kinds from 83,863,475 lbs. to 90,657,464 lbs. during the same respective periods, such, in the mean time, had been the increase in the demand for the European Continent, that, in regard to the foreign and colonial wools, the quantities returned for British consumption diminished in the five years from 76,139,899 lbs. in 1853 to 61,027,677 lbs. in 1857; and taking into account the quantities of English wools exported, there took place an aggregate reduction from 71,384,456 lbs. in 1853 to 47,535,291 lbs. in 1857. The significance of these statements will be better understood when attention is called to the fact avowed by The London Times, in a money article, that, simultaneously with this increase in the export of wool from the United Kingdom, the import of Continental woolen manufactures, especially French ones, was increasing.
From the figures furnished by Lord Stanley of Alderley we have abstracted the following tabular statement, showing the degree in which the balance of trade with Great Britain was favorable or unfavorable to different countries:
4. Russia 16,642,167 5. Prussia 12,842,488 6. Egypt 8,214,941 7. Spain 7,146,917 8. Br. West Indies 6,906,314 9. Peru 6,282,382 10. Sweden 5,027,934 11. Cuba & Porto Rico 4,853,484 12. Mauritius 4,672,090 13. New-Brunswick 3,431,303 14. Denmark 3,391,144 15. Ceylon 3,134,575 16. France 2,696,291 17. Canada 1,808,454 18. Norway 1,686,962 19. Africa (Western) 1,432,195 20. Portugal 1,283,075 21. Two Sicilies 1,030,139 22. Chili 693,155 23. Buenos Ayres 107,676
Balance of Trade in favor of England for 1855, 1856, 1857.
1. Hanse Towns 18,883,428 2. Australia 17,761,889 3. Turkey 6,947,220 4. Brazil 7,131,160 5. Belgium 2,214,207 6. Holland 1,600,904 7. Cape of G. Hope 59,661
The simple fact of the excess of British imports over exports, amounting in three years to £97,000,000 would by no means warrant the cry now raised by the Britishers "of carrying on their trade at a yearly sacrifice of £33,000,000," and benefiting by that trade foreign countries only. The enormous and increasing amount of British capital invested in all parts of the world must be paid for in interest, dividends and profits, all of which are to be remitted to a great extent in the form of foreign produce, and consequently go to swell the list of British imports. Beyond the imports corresponding to their exports, there must be a surplus of imports, remitted not in payment for commodities, but as revenue of capital. Generally speaking, the so-called balance of trade must, therefore, always be in favor of the world against England, because the' world has yearly to pay to England not only for the commodities it purchases from her, but also the interest of the debt it owes her. The really disquieting feature for England of the statements above made is this, that she is apparently at a loss to find at home a sufficient field of employment for her unwieldy capital; that she must consequently lend on an increasing scale, and similar, in this point, to Holland, Venice and Genoa, at the epoch of their decline, forge herself the weapons for her competitors. She is forced, by giving large credits, to foster speculation in other countries in order to find a field of employment for her surplus capital, and thus to hazard her acquired wealth in order to augment and conserve it. By being obliged to give large credits to foreign manufacturing countries, such as the Continent of Europe, she forwards herself the means to her industrial rivals to compete with her for the raw produce, and thus is herself instrumental in enhancing the raw material of her own fabrics. The small margin of profit thus left to the British manufacturer, still reduced by the constant necessity for a country the very existence of which is bound up with the monopoly of forming the workshop of the world, constantly to undersell the rest of the world, is then compensated for by curtailing the wages of the laboring classes and creating home misery on a rapidly-enlarging scale. Such is the natural price paid by England for her commercial and industrial supremacy.
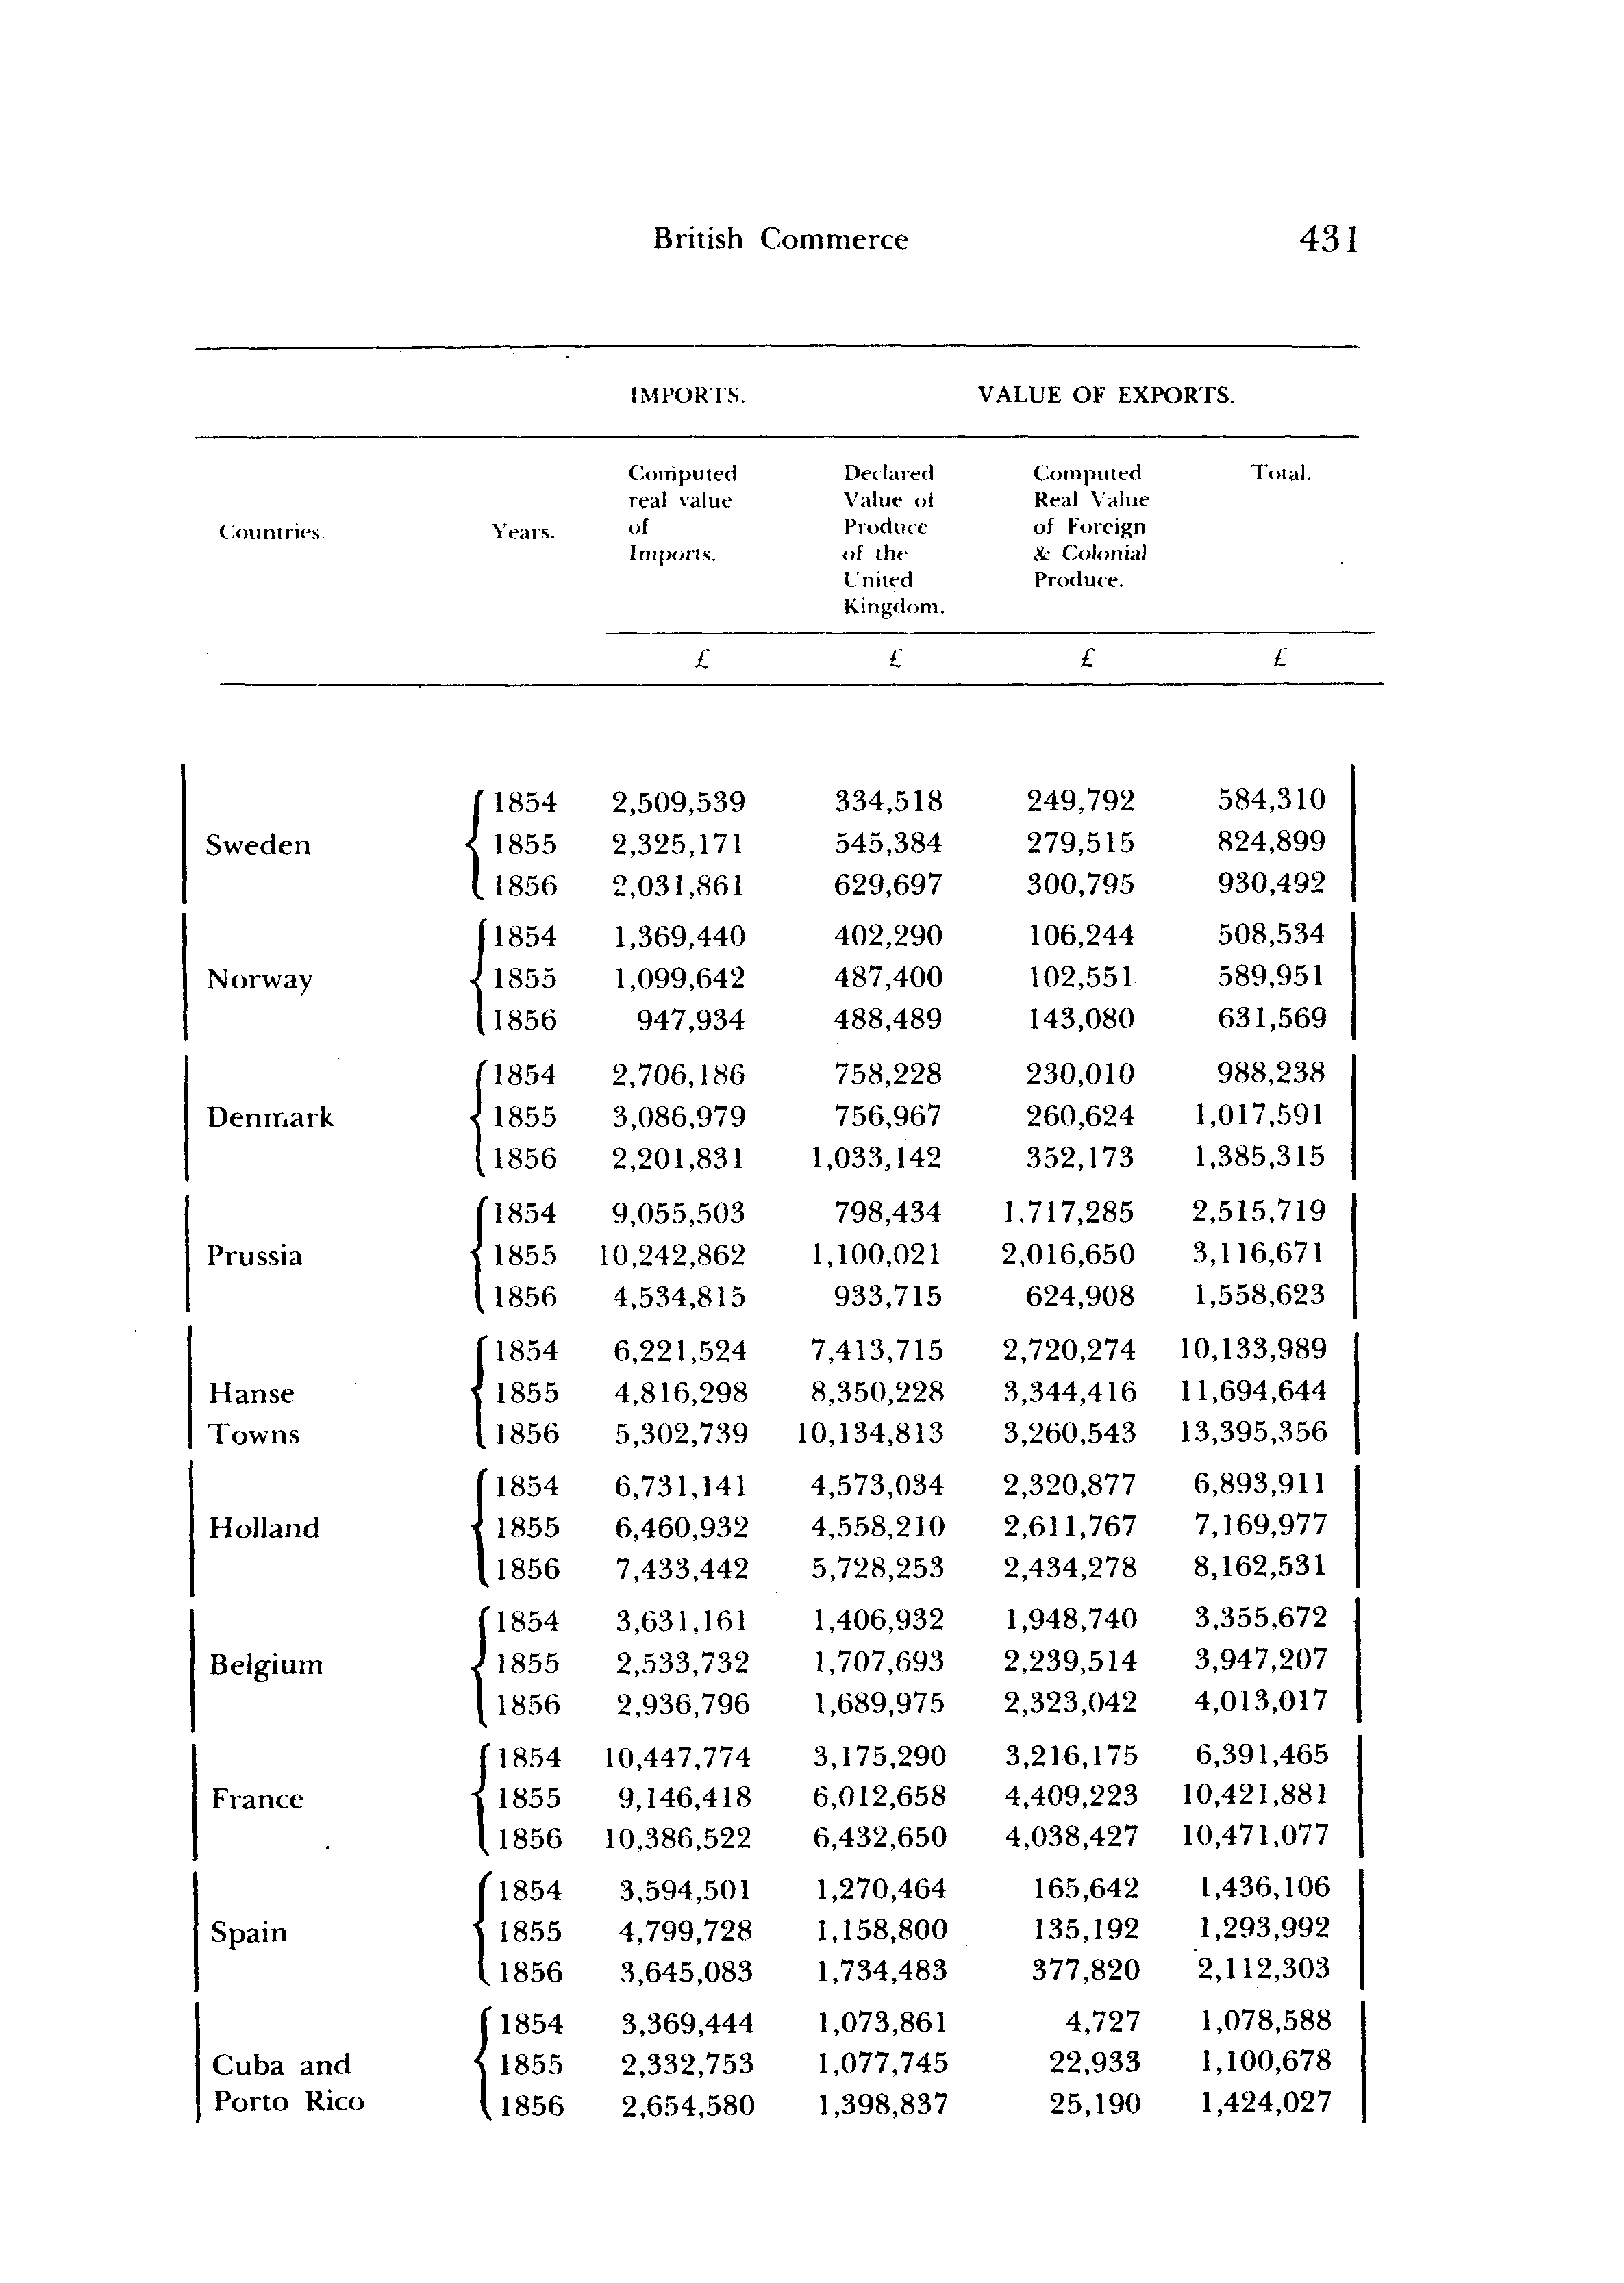
A Comparative Statement of the Value of the Imports and Exports of the United Kingdom
from and to the Principal Foreign Countries and British Possessions in 1854, 1855, and 1856.(5)
IMPORTS. VALUE OF EXPORTS.
Computed Declared Computed Total, real value Value of Real Value Countries. Years. of Produce of Foreign Imports. of the & Colonial United Produce. Kingdom.
£ £ £ £
Foreign.
{
1854 4,252,288 54,301 19,738 74,039 1855 478,169
Cuba and Porto Rico
IMPORTS. VALUE OF EXPORTS.
Countries. Years.
Computed real value of Imports.
Declared Value of Produce of the United Kingdom.
Computed Real Value of Foreign & Colonial Produce.
Total.
Countries. Years.
£ £ £ £
("1854 2,101,126 1,370,603 148,997 1,519,600 Portugal \ 1855 1,962,044 1,350,791 184,580 1,535,371 U856 2,164,090 1,455,754 433,470 1,889,224
Two Sicilies
f l 8 5 4 1,411,457 563,033 109,258 672,291 Two Sicilies <! 1855 1,281,940 921,220 175,221 1,096,441 [1856 1,505,582 1,202,183 197,925 1,400,108
Turkey Proper
[l854 2,219,298 2,758,605 317,476 3,076,081 Turkey Proper i 1855 2,294,571 5,639,898 419,119 6,059,017 Turkey Proper 11856 2,383,029 4,416,029 291,991 4,708,020
(1854 3,355,928 1,253,353 113,895 1,367,248 Egypt < 1855 3,674,682 1,454,371 117,235 1,571,606 11856 5,753,518 1,587,682 43,151 1,630,833
United States fl854 29,795,302 21,410,369 923,034 22,333,403 (including -I 1855 25,741,752 17,318,086 744,517 18,062,603 California) (l856 36,047,773 21,918,105 698,772 22,616,877
M 854 2,083,589 2,891,840 119,982 3,011,822 Brazil J 1855 2,273,819 3,312,728 128,550 3,441,278 ( 1856 2,229,048 4,084,537 179,979 4,264,516
Buenos [1854 1,285,186 1,267,125 32,565 1,299,690
Ayres J 1855 1,052,033 742,442 26,383 768,825 (1856 981,193 998,329 43,892 1,042,221
[1854 1,380,563 1,421,855 .43,589 1,465,444 Chili J 1855 1,925,271 1,330,385 56,688 1,387,073 11856 1,700,776 1,396,446 64,492 1,460,938 IMPORTS. VALUE OF EXPORTS.
Countries. Years.
Computed real value of Imports.
Declared Value ol Produce of the United Kingdom.
Computed Real Value of Foreign & Colonial Produce.
Total.
Countries. Years.
£ £ £ £
W. C. of Africa (exclusive of Br. & Fr. Pos.)
(1854 J 1855 (1856
1,528,896 1,516,729 1,657,375
646,868 839,831 666,374
174,073 219,827 223,842
820,941 1,059,658
890,216
Total fl854 118,239,554 63,800,605 15,645,612 79,446,217 Foreign I 1855 109,959,539 69,524,475 18,710,749 88,235,224 Countries 11856 129,517,568 83,327,154 20,035,442 103,362,596
British Possessions
f 1854 4,007,052 3,957,085 180,569 4,137,654 Canada i 1855 2,296,277 1,515,823 90,298 1,606,121 11856 3,779,741 2,418,250 123,591 2,541,841
New-Brunswick '"->
fl854 J 1855 U856
2,079,674 . 4,379,041 1,891,707
863,704 370,560 572,542
40,273 27,718 34,322
903,977 398,278 606,864
British West India Islands
fl854 -J1855
3,977,271 3,978,278
1,870,674* 1,389,992
166,690 136,022
2,037,364 1,526,014 British West India Islands 11856 4,157,098 1,462,156 180,799 1,642,955
British Guiana
fl854 1,636,267 31,779 31,779 British Guiana •J1855 1,491,935 421,398 35,189 456,587 British Guiana \1856 1,418,264 411,241 41,248 452,489
British Setde-(1854 4,301,868 11,931,352 1,474,634 13,405,986 ments in Aus-} 1855 4,500,200 6,278,966 942,659 7,221,625 tralia tl856 5,736,043 9,912,575 1,759,814 11,672,389
British East Indies
(1854 J 1855 11856
10,672,862 12,668,732 17,262,851
9,127,556 9,949,154 10,546,190
493,154 404,321 478,328
9,620,710 10,358,475 11,024,518
(1854 1,506,646 382,276 31,228 413,504 Ceylon •J 1855 1,474,251 305,576 20,321 325,897 I 1856 1,304,174 388,435 22,660 411,095 IMPORTS. VALUE OF EXPORTS.
Computed real value
Declared Value of
Computed Real Value
Total.
Countries. Years. of Imports.
Produce of the United Kingdom.
of Foreign & Colonial Produce.
Countries. Years.
£ £ £ £
f 1854 1,677,533 383,210 17,936 401,146 Mauritius i 1855 1,723,807 303,173 14,772 317,945 (l856 2,427,007 420,180 16,977 437,157
Cape of Good Hope & Brit. Pos. in S. Afr'a
1854 1855 1856
691,352 949,640 1,502,828
921,957 791,313 1,344,338
63,309 45,437 73,127
985,266 836,750 1,417,465
Total of British Possessions
1854 34,149,499 33,384,121 1855 33,583,311 26,163,610 1856 43,026,586 32,499,794
2,990,754 36,374,875 2,292,466. 28,456,076 3,357,963 35,857,757
Total Foreign Countries and Br. Pos-ses'ns. tf
854 1855 1856
152,389,053 143,542,850 172,544,154
97,184,726 95,688,085 115,826,948
18,636,366 115,821,092 21,003,215 116,691,300 23,393,405 139,220,353